What Does It Mean to Write Results in a Research Paper?
- When you write results in a research paper, you are objectively reporting what you found during your study, without interpreting, explaining, or evaluating what those findings mean. That interpretation belongs later, in the discussion section.
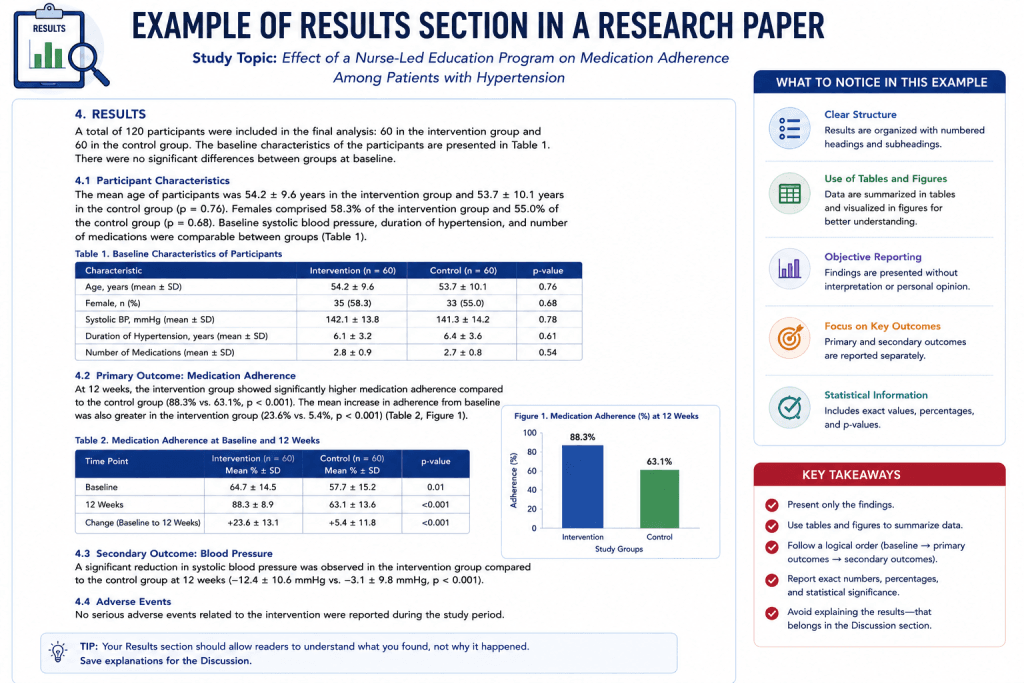
- Learning how to write results in a research paper starts with understanding that this section of a research paper is purely factual. It is where you present your data in the form of text, tables, and figures, using descriptive statistics and inferential statistics to show what actually happened in your experiment or study.
- The results section of a research paper answers your research questions directly. If your hypothesis predicted a specific outcome, this is where you state, in past tense, whether the data supported it or not — without discussing why.
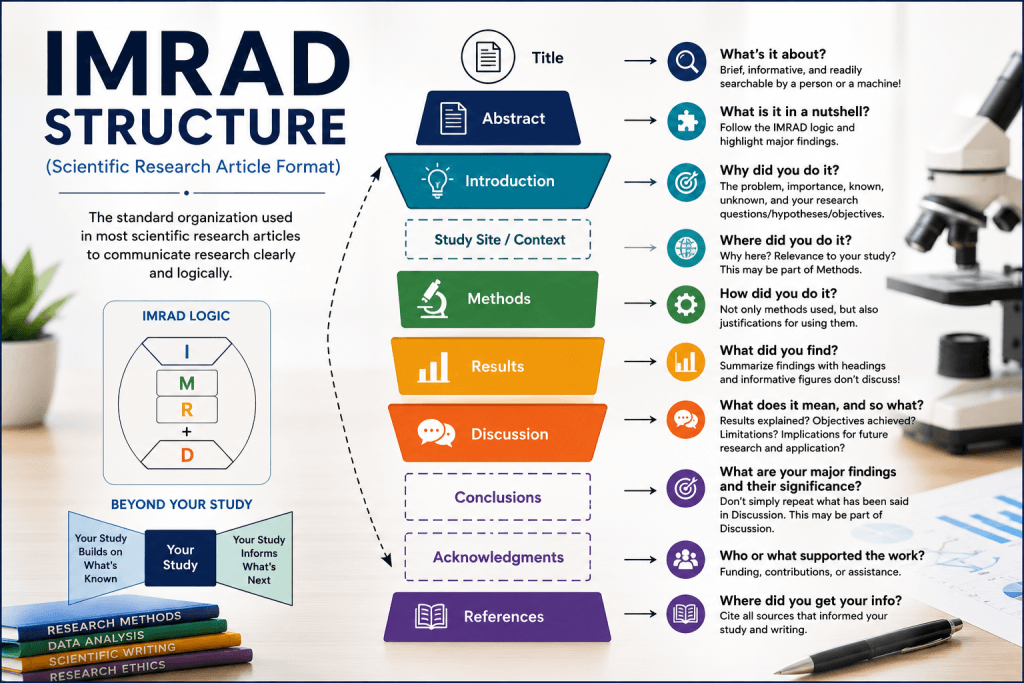
- Many students and early-career researchers confuse the results section with the discussion section. Knowing how to write results in a research paper means understanding this key distinction:
- The results section presents your findings.
- The discussion section interprets those findings, compares them to existing literature, and explains their significance.
- A well-written results section of a research paper typically includes:
- A narrative summary of your main findings, written concisely in the text.
- Tables and figures that present numerical data clearly.
- Statistical results, including p-values, confidence intervals, and standard deviation where relevant.
- In short, when you write the results section, your goal is to summarize what you observed — clearly, concisely, and in a logical order — so that a reviewer or reader can quickly grasp your key findings before moving on to your interpretation of them.
- Understanding how to write results in a research paper is the first building block toward writing a scientific paper that reviewers and readers can trust and follow with ease.
- Before you move on to drafting, it helps to remember that how to write results in a research paper is really a question of discipline: report only what you measured, in the order you measured it, and let the numbers speak for themselves.
How to Write Results in a Research Paper in 5 Easy Steps
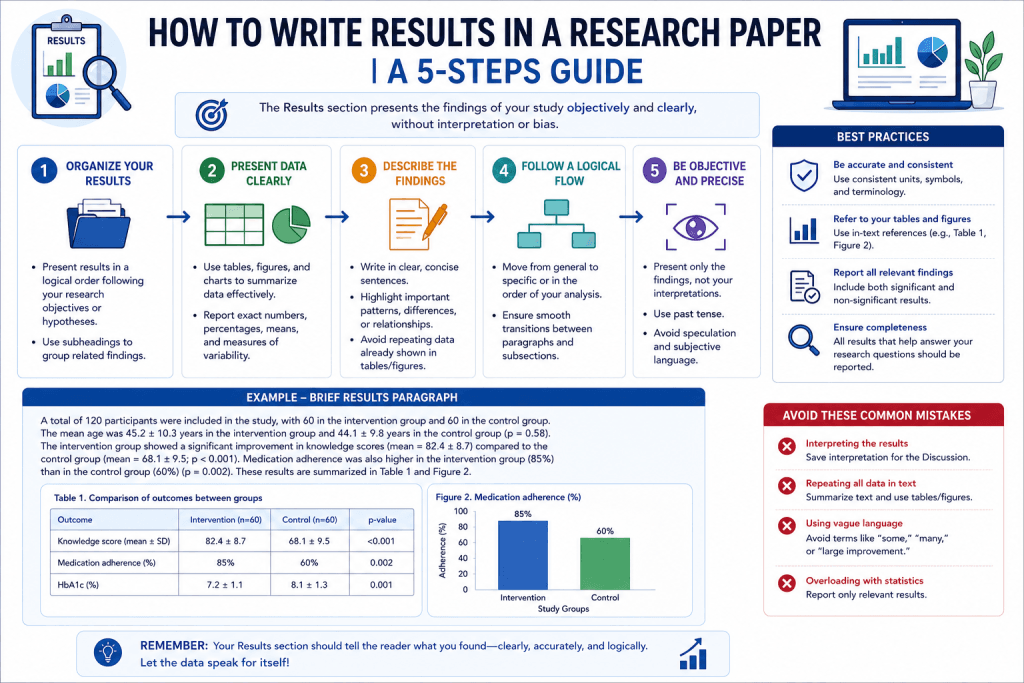
Whether you’re writing your first scientific article or refining your tenth, these five steps will guide you through exactly how to write results in a research paper — consistently and confidently, every time.
Step 1: Revisit Your Research Question and Hypothesis
- Before you write the results, reread your research question and hypothesis. This keeps your results section focused and prevents you from including irrelevant data.
- Ask yourself: what data do I need to present in order to directly answer my research questions?
- This step is essential to how to write results in a research paper because it shapes the entire structure of the section — every subheading and every figure should tie back to your original question.
- Make a short list of the variables you measured and the analyses you ran. This becomes your roadmap for the rest of the section, and it’s a step many guides on how to write results in a research paper skip too quickly.
Step 2: Organize Your Findings in a Logical Order
- Once you know what you need to report, organize your findings in a logical order — often chronological order, or in the same order your materials and methods section introduced them.
- A common practice when learning how to write results in a research paper is to structure your results the same way you structured your methods section, so readers can follow the connection between what you did and what you found.
- Group related findings together. For example, present all demographic data first, then move into your primary outcomes, followed by secondary or exploratory analyses. This grouping habit is one of the simplest ways to practice how to write results in a research paper without losing your reader along the way.
- This organizational step is one of the most overlooked parts of how to write results in a research paper, yet it has the biggest impact on readability.
- A logical order also helps a reviewer evaluate your research results quickly, without needing to jump back and forth between sections.
- If you’re still unsure how to write results in a research paper in a way that feels organized rather than scattered, try outlining your subheadings before you write a single sentence of full text.
Step 3: Present Descriptive Statistics First
- Start each subsection with descriptive statistics — means, standard deviation (often written as ±), percentages, and ranges — before moving into more complex statistical tests.
- Descriptive statistics give readers a baseline understanding of your data before you introduce inferential statistics, which test relationships or differences between variables.
- This is a core rule for writing a results section: report descriptive and inferential statistics separately, and always in that order. It’s a rule that applies whether you’re working in the biological sciences or the social sciences.
- Example structure:
- “Participants had a mean age of 34.2 ± 6.1 years.”
- Then follow with the inferential statistics: “A significant difference was found between groups (p < 0.05).”
- Getting this order right is one of the most practical tips for how to write results in a research paper, because it mirrors how readers naturally process numerical information.
Step 4: Use Past Tense and Objective Language Throughout
- One of the most common mistakes researchers make is inconsistent tense. When you write results in a research paper, always use past tense, since you are describing something that has already happened.
- Reserve present tense for statements of general fact or when referring to a table or figure itself (e.g., “Table 1 shows the results”).
- Avoid subjective or evaluative language. Words like “surprisingly” or “unfortunately” belong in the discussion section, not here. Present your data objectively.
- Keep sentences concise. Reviewers and readers appreciate a results section that states findings plainly, without unnecessary elaboration — and this is a hallmark of anyone who has mastered how to write results in a research paper.
Step 5: Integrate Tables and Figures With Clear Captions
- Use figures and tables to present dense numerical data that would be cumbersome to describe in text alone.
- Every figure or table needs a clear, standalone caption that allows a reader to understand it without reading the full text.
- Reference each table and figure in the text (e.g., “as shown in Table 1”) but avoid repeating every number that already appears in the table.
- This final step ties together everything you’ve learned about how to write results in a research paper: your text, your tables and figures, and your statistical analyses should all work together to tell a clear, cohesive story of your findings.
Following these five steps consistently is the most reliable way to learn how to write results in a research paper, and it will make writing a scientific paper’s results section far less intimidating over time.
Why Learning How to Write Results in a Research Paper Matters for Your Scientific Paper
- Understanding how to write results in a research paper isn’t just an academic exercise — it directly affects how your work is received, understood, and cited.
- A clearly written results section builds credibility. Reviewers evaluate your scientific paper based on how well you present your data and whether your statistical analyses are sound and clearly reported.
- Poorly structured results can obscure your key findings, even if your research itself is strong. If a reviewer struggles to find your main findings among cluttered text or confusing tables and figures, your paper’s chances of acceptance drop.
- Knowing how to write results in a research paper also helps you separate results from discussion, which is a frequent point of confusion for early-career researchers. Journals expect a clear boundary: the results and discussion sections serve different purposes, and blending them can lead to desk rejection.
- In fields like the biological sciences, where studies often involve multiple variables, groups, and statistical tests, a well-organized results section becomes even more critical. Readers need to be able to compare groups, follow your statistical tests, and understand your findings without wading through interpretation.
- A strong results section also makes peer review faster and smoother. Reviewers who can quickly locate your research results, statistical significance, and key findings are more likely to evaluate your paper favorably.
- Learning how to write results in a research paper is also a transferable skill. Once you understand the format, you can apply it across a scientific article, a thesis chapter, a grant report, or a conference abstract — anywhere you need to present your findings clearly and concisely.
- In short, how to write results in a research paper is a foundational skill for any researcher who wants their work taken seriously, understood accurately, and cited confidently by others in their field. It’s a skill worth investing time in early, because it pays off across every scientific paper you write for the rest of your career.
How to Use Graphs, Tables, and Captions When You Write Results in a Research Paper
Visual elements are one of the most powerful tools for presenting research results clearly, and knowing how to use them well is a key part of how to write results in a research paper effectively. In fact, many guides on how to write results in a research paper underestimate just how much a well-designed graph or table can strengthen a reader’s trust in your findings.
When to Use a Graph vs. a Table
- Use a graph when you want to show trends, comparisons, or relationships between variables — for example, changes over time or differences between groups.
- Use a table when you have precise numerical data that readers may need to reference exactly, such as multiple statistical values, sample sizes, or demographic breakdowns.
- A good rule of thumb: if the pattern matters more than the exact number, use a graph. If the exact number matters more than the pattern, use a table.
- This distinction is one of the smaller but important details in how to write results in a research paper, since choosing the wrong format can make your data harder to interpret.
Best Practices for Using Figures and Tables
- Keep tables and figures uncluttered. Include only the data necessary to support your main findings — extra variables or unrelated data can overwhelm the reader.
- Label all axes on a graph clearly, including units of measurement.
- Use consistent formatting across all your tables and figures, including font size, decimal places, and how you report standard deviation (typically as mean ± SD).
- Number your tables and figures sequentially (Table 1, Table 2, Figure 1, Figure 2) in the order they appear in the text.
- Following a consistent format across all your visuals is a small habit that makes a big difference when you write results in a research paper, since it signals professionalism and attention to detail to reviewers.
Writing Effective Captions
- A caption should allow a reader to understand a figure or table without reading the surrounding text. This is a golden rule in writing a scientific paper.
- Every caption should include:
- What the figure or table shows.
- The variables being measured.
- Sample size, if relevant.
- Any statistical test used, if applicable (e.g., “Error bars represent standard deviation”).
- Keep captions concise but complete. A reviewer skimming your scientific article should be able to understand your data in the form of a table or graph purely from the caption.
- Mastering the caption is a small but often-missed piece of how to write results in a research paper, and it can save your reader significant time.
Integrating Visuals Into the Text
- Don’t just insert a table or figure and move on — reference it directly in your text. For example: “As shown in Figure 2, mean scores increased significantly across the three time points.”
- Avoid duplicating every number from a table in your written text. Instead, summarize the key findings and direct readers to the table or figure for full detail.
- When you write results in a research paper, aim for a balance: the text should guide readers through the story of your data, while tables and figures provide the detailed evidence.
- Using figures and tables effectively is one of the clearest signs that a researcher understands how to write results in a research paper, and it significantly improves how reviewers and readers evaluate your work.
Results Section vs. Discussion Section: Key Differences in the Biological Sciences
Understanding the difference between the results and discussion sections is essential, especially in the biological sciences, where studies often involve complex statistical analyses and multiple experimental groups. This is often the trickiest part of how to write results in a research paper for new researchers, and getting it right is what separates a polished scientific paper from one that needs major revisions.
Purpose
- The results section presents your findings objectively — what you observed, measured, or calculated — without interpretation.
- The discussion section interprets those findings: what they mean, how they relate to your hypothesis, and how they fit within the broader body of research in your field.
- A simple way to remember this: the results section answers “what did I find?” while the discussion section answers “what does it mean?” Keeping this distinction in mind is central to how to write results in a research paper without accidentally drifting into interpretation.
Content and Structure
- In the results section, you report descriptive statistics and inferential statistics, present tables and figures, and describe outcomes in past tense without evaluation.
- In the discussion section, you evaluate your research results, compare them to prior studies, acknowledge limitations, and explain the implications of your findings for the field, such as biological sciences.
- Some scientific papers combine these into “results and discussion sections,” particularly in shorter research articles or certain biological sciences journals. Even then, it’s best practice to keep the objective reporting of data separate from the interpretation, using clear subheadings or paragraph breaks.
- Even when sections are combined, understanding how to write results in a research paper as a distinct, objective block of content will keep your writing clean and easy to follow.
Tone and Language
- The results section uses neutral, objective language: “Group A showed a 15% increase in enzyme activity compared to Group B.”
- The discussion section allows for more interpretive language: “This increase may suggest that enzyme activity is influenced by temperature-dependent factors, consistent with previous findings.”
- Tense matters here too — both sections generally use past tense to describe what was found, but the discussion section may shift into present tense when referring to established scientific understanding.
Common Mistakes to Avoid
- Don’t interpret your findings while still writing the results — save phrases like “this suggests” or “this indicates” for the discussion section.
- Don’t introduce new data in the discussion section. All research results should appear first in the results section.
- Don’t repeat your results word-for-word in the discussion — summarize and build on them instead.
- In the biological sciences specifically, be careful to clearly separate statistical significance (a results section topic) from biological significance or real-world relevance (a discussion section topic).
- Keeping these separate results and discussion sections distinct not only meets journal expectations but also makes your scientific article easier to read, review, and cite — and it’s one of the clearest markers of someone who has learned how to write results in a research paper properly.
Checklist for How to Write Results in a Research Paper Before You Submit
Before submitting your scientific paper, run through this checklist to make sure you’ve correctly applied everything you know about how to write results in a research paper.
Content Checklist
- [ ] Have you addressed every research question and hypothesis stated in your introduction?
- [ ] Did you present both descriptive statistics and inferential statistics where appropriate?
- [ ] Are your key findings clearly highlighted, rather than buried in dense paragraphs?
- [ ] Have you avoided including any interpretation, opinions, or comparisons to other studies (save these for the discussion section)?
Formatting Checklist
- [ ] Is your results section organized in a logical order, ideally mirroring your methods section?
- [ ] Have you used past tense consistently throughout the text?
- [ ] Did you report standard deviation and other statistics in a consistent format (e.g., mean ± SD)?
- [ ] Are all tables and figures numbered sequentially and referenced in the text?
Tables and Figures Checklist
- [ ] Does every figure or table have a clear, standalone caption?
- [ ] Are your graphs labeled correctly, with units included on each axis?
- [ ] Have you avoided cluttering tables and figures with unnecessary variables?
- [ ] Does the text summarize your tables and figures without repeating every number?
Statistical Accuracy Checklist
- [ ] Have you reported exact p-values and confidence intervals where relevant?
- [ ] Are your statistical tests appropriate for the type of data and variables you collected?
- [ ] Did a colleague or mentor double-check your statistical analyses for accuracy?
Final Review Checklist
- [ ] Read your results section aloud, or have someone else read it, to check that it flows naturally and stays concise.
- [ ] Confirm that your results and discussion sections are clearly separated, even if your target journal combines them.
- [ ] Ask a trusted reviewer, mentor, or colleague to check whether your results section makes sense without reading the rest of the paper.
- [ ] Do one final pass focused only on how to write results in a research paper concisely — cut any sentence that doesn’t add new information for the reader.
Working through this checklist every time you sit down to write results in a research paper will help you build a consistent, reliable process — one that saves time, reduces revisions, and strengthens every scientific paper you write. Mastering how to write results in a research paper isn’t a one-time skill; it’s a habit you refine with every submission, and this checklist is designed to make sure you never miss a step.
- George Mason University Writing Center – Scientific (IMRaD) Research Reports: Overview – https://writingcenter.gmu.edu/writing-resources/imrad/writing-an-imrad-report
- Utah Valley University Writing Center – Scientific Writing: IMRaD – https://www.uvu.edu/writingcenter/handouts/scientific-writing.html
- Brigham Young University Research & Writing Center – Scientific Writing: IMRAD Format – https://rwc.byu.edu/00000188-e4bc-d222-a7ea-eefd769e0000/scientific-writing-imrad-format-pdf